Plants and quadrats
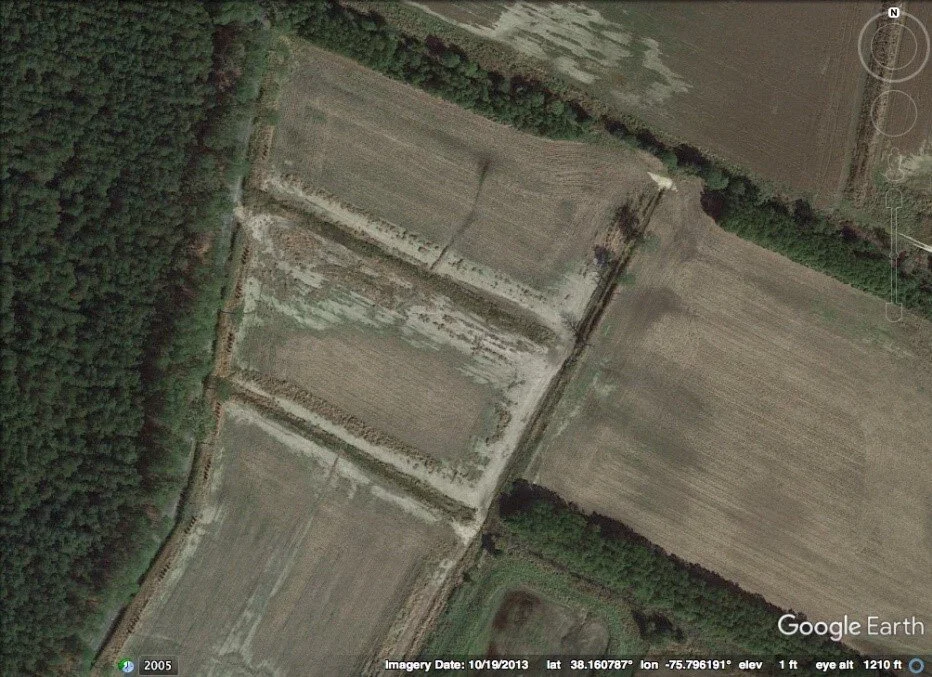
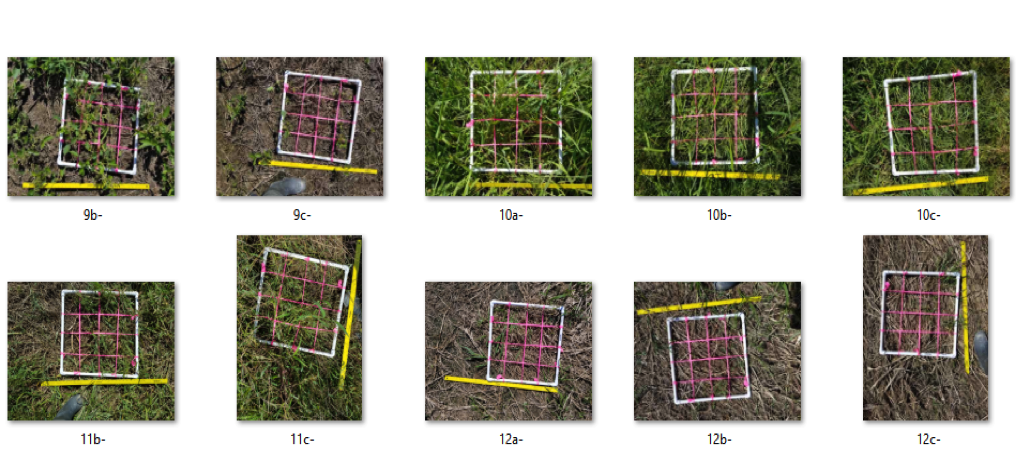
Last semester I visited Elizabeth de la Reguera’s study sites on the Eastern Shore of Maryland. We prepared and planted small research plots with switchgrass, barley and wheat. Elizabeth is studying the effects of saltwater intrusion on crop productivity and survival. Over winter break, I continued to work on this research by gathering data on how well the different plant species were growing in each plot. The AgroEcoLab manager, Cullen McAskill, gave me hundreds of pictures from the site, and I got to work! Cullen had placed a quadrat on the plots in the fall, so that we could determine the species of different plants within a grid. Imagine trying to count each plant individually in each plot! Instead, the quadrat is placed at each plot in random so that it isolates an area that can then be used to represent how much of that plant species is in that plot. My job was to take each picture individually with the quadrats and set a scale in which we would tell the program, SamplePoint, to count how many plants were within those quadrats. Gathering all this data will not only tell us what species is doing the best or worst in salty conditions, but it will also provide us with the information we need to improve any management techniques in the future.